Stop Drowning in Data: Tame Your Azure Logs with KQL

You’ve probably found yourself in a situation where you have lots of logs coming into your Log Analytics Workspace for Sentinel or Azure Data Explorer and wondered to yourself — “OK I got a lot of stuff coming in but now what? How can I find what I’m searching for in this forest of data?”.
I know for sure that I did once I started working with Sentinel, but once I’ve learned how I can get the necessary data that I need with KQL queries I have really started to enjoy the process.
Kusto Query Language (KQL) in a nutshell
KQL is a powerful tool to explore your data and logs, discover different anomalies, and patterns, create visualizations, etc. Language itself is quite easy to read and understand (which was really a sigh of relief on my part) and by using it you can do different queries related to the metrics, telemetry logs, and parsing amongst many other things.
Query schema itself uses entities that are organized in a similar fashion to SQL: databases, tables, and columns.
KQL In different service
By default, KQL is used by many other Microsoft services:
Log queries in Azure Monitor
Logs inside Microsoft Sentinel Log Analytics workspace
Azure Resource Graph with his version of the query language
Proactive threat-hunting with advanced hunting in the Defender portal
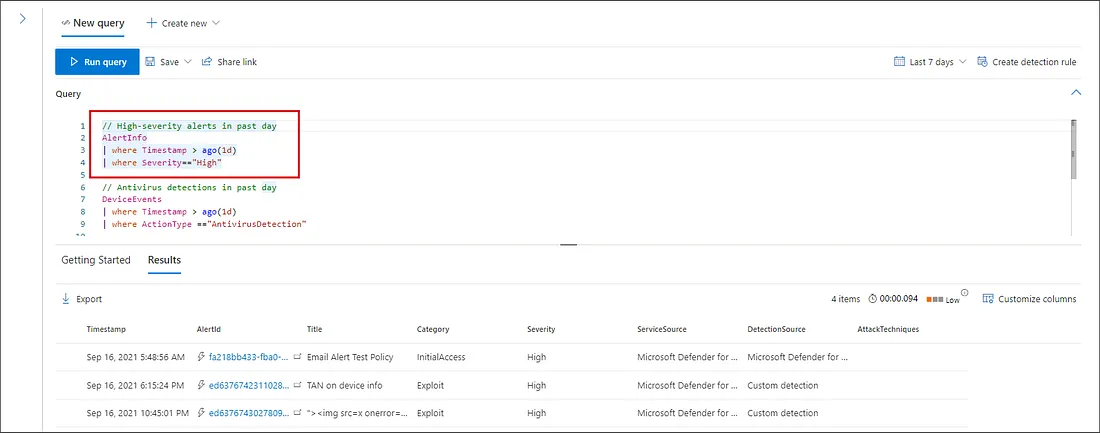 Sample of KQL queries in Microsoft Defender XDR portal — image courtesy of Microsoft
Query statements
There are 3 kinds of user query statements:
- Tabular expression statement — is what people usually have in mind when they talk about queries — it is generally composed of tabular data sources such as tables, tabular data operators (such as filters and projections), and optional rendering options.
1
2
3
StormEvents
| where State == "FLORIDA"
| count
The following query counts the number of records in the StormEvents table that have a value of “FLORIDA” in the State column. Composition is represented by pipe character (|), giving the statement a regular form that visually represents the flow of tabular data from left to right.
- Let statement - is being used to set a variable name equal to an expression or a function. They are handy for:
Breaking up complex expressions into multiple parts which are represented by variable
Defining different constraints outside of the query body for better readability
Defining a variable once and reusing it multiple times:
1
2
3
4
5
6
let n = 10; //number
let place = "ILLINOIS"; //string
let cutoff = ago(365d); //datetime
StormEvents
| where EndTime < cutoff and place == State
| take n
This above query filters the StormEvents table to include only those records where:
The EndTime is earlier than the cutoff date (events that ended more than a year ago). The State column matches the string “ILLINOIS”.
It then uses the take operator to return only the first n records from the filtered results, which in this case is 10 records.
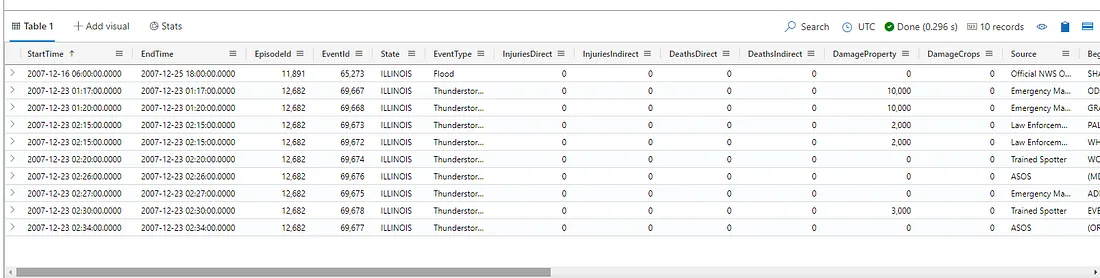 Visualization of results based on KQL query on Azure Data Explorer Playground
- Set statement - A set statement is used to set a request property for the duration of the query. Request properties control how a query executes and returns results. They can be boolean flags, which are
falseby default, or have an integer value. A query may contain zero, one, or more set statements. Set statements affect only the tabular expression statements that trail them in the program order. Any two statements must be separated by a semicolon.
Request properties - Azure Data Explorer & Real-Time Analytics
All of the above-mentioned query statements are separated by a ; (semicolon), and only affect the query at hand.
Azure Data Explorer Playground
For testing out these queries Microsoft was also kind enough to provide us a playground on which you log in with your Azure account. This way you can play around with KQL queries using sample provided tables.
In these next few examples I will be using StormEvents table from Samples to showcase different operators that can be used to filter the data, but before that here is a visualization of how filtering down data works in KQL.
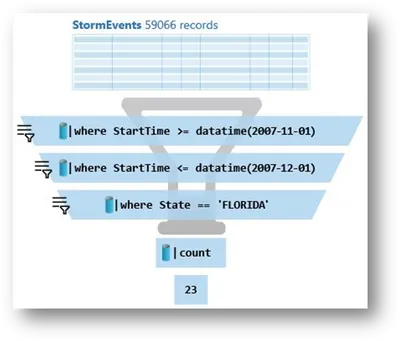 KQL filtering visualization — image courtesy of Microsoft Tech Community
So here is the sample of the KQL query workflow:
1
2
3
4
5
StormEvents
| where StartTime between (datetime(2007-01-01) ..datetime(2007-01-12))
| where EventType == "Flood" or EventType has "Thunderstorm"
| summarize Count = count() by State
| render barchart
On the first line, I have selected StormEvents table
All the new lines start with “
|” as I mentioned above I filtered out the logs between the 1st of January and 12th of January, 2007 with between operatorIn line 3 I filter it out even more to see just where EventType is either “Flood” or has “Thunderstorm” in the string.
On line 4 with the operator summarize I count the number of all the records by each state
Finally, I use render barchart to visualize data as a graph for each State
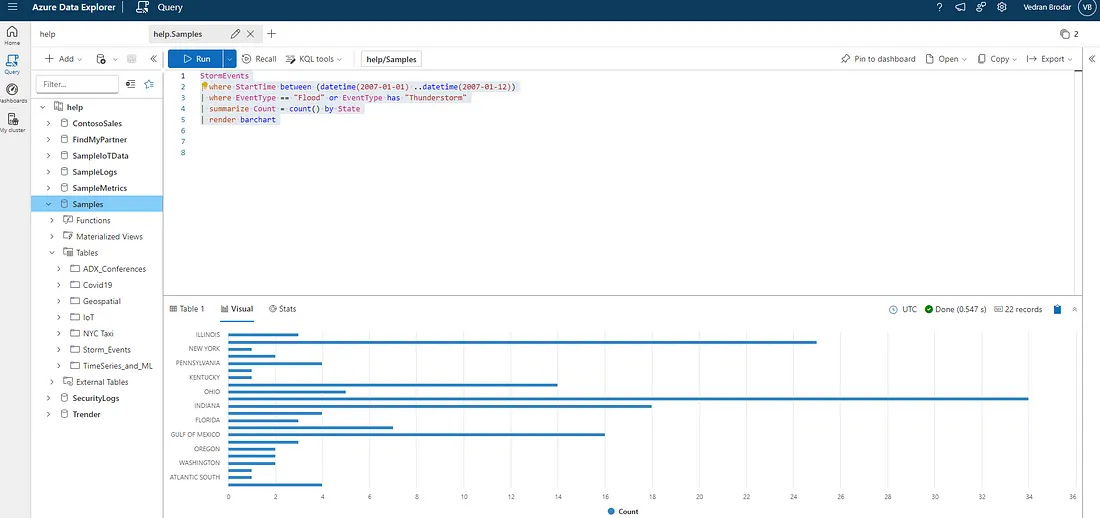 Result visualization of the number of Floods and Thunderstorms per State
If for example, I wanted different results to just show me StartTime, State, EventType, and EventNarrative to get more information about what happened I would write something like this:
1
2
3
4
StormEvents
| where StartTime between (datetime(2007-01-01) ..datetime(2007-01-12))
| where EventType == "Flood" or EventType has "Thunderstorm"
| project StartTime, State, EventType,  EventNarrative
As a result, I can see 153 records:
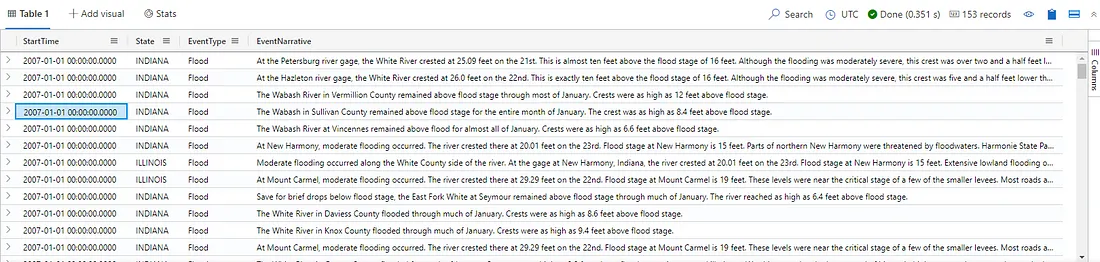 Query more focused on EventNarrative
KQL best practices and docs
This was just a short introduction to the basic capabilities of KQL, below I will provide the list of all the useful docs and best practices.
Must Learn KQL with all the documentation provided by Rod Trent
Kusto Detective Agency — Game-like experience where you are trying to solve cases by using KQL
All of those links were quite useful when I started, but as you can see as long you know what your requirements are, and what you are aiming to find you can narrow it down to that specific log.
In future articles, I will come back to the subject of KQL because it is quite an extensive topic on its own, so stay around for new ones.
Conclusion
Thank you for reading the article, I hope it was useful and comprehensive. If you’ve liked it - share it around. It would mean a lot. On the same note, check out the articles written by Martina on CrowdStrike and different EDR/MDR/XDR topics and also you can check out Hrvoje’s articles related to Penetration testing, red teaming, and offensive security
For all the questions and all your feedback on the subject, you can find me on LinkedIn and read the rest of our articles here on CyberDnevnik
Cheers,
Vedran